
|
By Matt Florell 2014-11-05
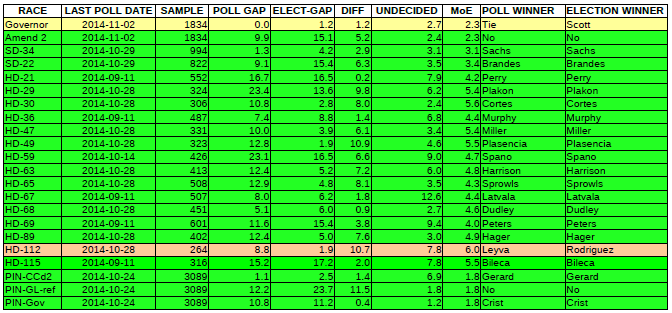
During the 2014 General Election season this year we polled over 40 different Florida races, some of them more than a half-dozen times. Over 20 of those races were released as public polls, and above you can see how we did at predicting the winner and the gap between the winner and loser of our polls compared to the final election results. One of the things you notice looking at the chart above is that there is a whole lot of green up there. With the exception of the HD-112 race and the Governor's race(where we showed an exact tie in our last poll 2 days before the election), we called every other winner that we polled. Now that's not to say that we weren't pretty far off on the margins of some of those victories. In several of the districts with larger Spanish populations, we often had lower sample sizes and inadequate Hispanic respondent shares. That is to be expected when you only place phone calls in English. This lead to our lower accuracy in several of those races. Also, most of these polls used 2010 General election turnout demographics, which proved to be somewhat different from the demographics of the people who voted in this election. During election day itself, I monitored the live turnout numbers in 8 different Florida counties that had the information made available and regularly updated. What I saw when comparing this information to the 2010 turnout information is that the registered Republican vote share had declined across the board an average of more than 3%, and the NPA and Independent vote share increased as a result, with token improvements in registered Democratic vote share. Because of this change in demographics, most of our polls underestimated the Independent vote and overestimated the Republican vote. This lead to our over-estimation of the margin of victory in the HD-59, HD-63 and HD-65 races(these three are in counties that saw some of the steepest Repubican vote share drops compared to 2010). We polled the race for Governor of Florida three times, with each one showing the race close to a dead-heat. Our October 8th poll actually showed Republican Rick Scott winning by the exact margin he won on election day: 1.2%. Our October 17th poll right after the second debate showed Democrat Charlie Crist ahead by 1.4%. One other note on the Governor's race, Libertarian Adrian Wyllie seems to have suffered from the same third party candidate problem that Lucas Overby suffered in the CD-13 special election here in Pinellas County in March. His polling was twice as high as the percent of votes people actually cast for him. Next, local Pinellas County races. This is our home turf, so we poll these races often and with larger sample sizes. The County Commission district 2 seat polled very close every time we polled it, but just a week before the election we polled a very large sample with demographics adjusted for the early voting demographics we were seeing up to that point, and even with a Republican +4.7% advantage, Democrat Pat Gerard was very slightly ahead of Republican Ed Hooper. Adjusting the results for the final Republican advantage that was 1.2% lower than that, we ended up hitting this race almost exactly on the head. We also were extremely close on how Pinellas County would vote for Governor, with Charlie Crist winning the county by 11%. Another local race here in Pinellas county was the "Greenlight Pinellas" transit referendum. We had polled this highly contested ballot measure many times over the last year, and in the end, even though the other two races ended up very accurate, our poll showed it losing by 12%, when the final vote had it losing by almost 24%. The only time we had a result that was close to that big of a margin is when a client paid for what was considered at the time a rather slanted poll against the measure back in July. In the end, maybe that's how the voters saw the referendum. One final note on a rather strange phenomenon that we've seen over the last few elections. In the race for Governor and Amendment 2, the CD-13 special election, the CD-19 special election, and the St. Petersburg Mayoral election last year, the most accurate results have come from polls conducted 3-4 weeks before election day. After that, the polls in those races got less acccurate. I'm not sure if that is because there are people that would take the poll early on, then would not take them closer to the election, but it is somthing we will be watching for in future elections. |


